Drunk driving remains a significant public safety issue in America, despite efforts to raise awareness and reform laws. DUI statistics highlight progress, but also point to areas needing improvement, with trends revealing both successes and ongoing challenges. By analyzing arrest rates, fatalities, and demographics, we can identify where prevention efforts work and where more attention is required to protect communities.
National DUI Arrest Trends
Overall Arrest Patterns
FBI data shows approximately 1 million DUI arrests occur annually in the United States, making drunk driving one of the most common criminal charges. This represents roughly one arrest for every 240 licensed drivers each year, though arrest rates vary significantly by state and region.
Arrest numbers have generally declined over the past two decades, from peaks of over 1.5 million annual arrests in the early 2000s. This downward trend reflects both changing social attitudes toward drunk driving and evolving enforcement strategies that emphasize prevention alongside punishment.
However, these declining arrest numbers don’t necessarily indicate reduced drunk driving behavior. Some experts suggest that modern ride-sharing services, increased public awareness, and stronger social disapproval of drunk driving contribute to fewer people choosing to drive while impaired.
The relationship between arrests and actual impaired driving incidents remains complex. Studies estimate that the average drunk driver operates a vehicle while impaired 80 times before being arrested, suggesting that reported arrests represent only a fraction of actual drunk driving episodes.
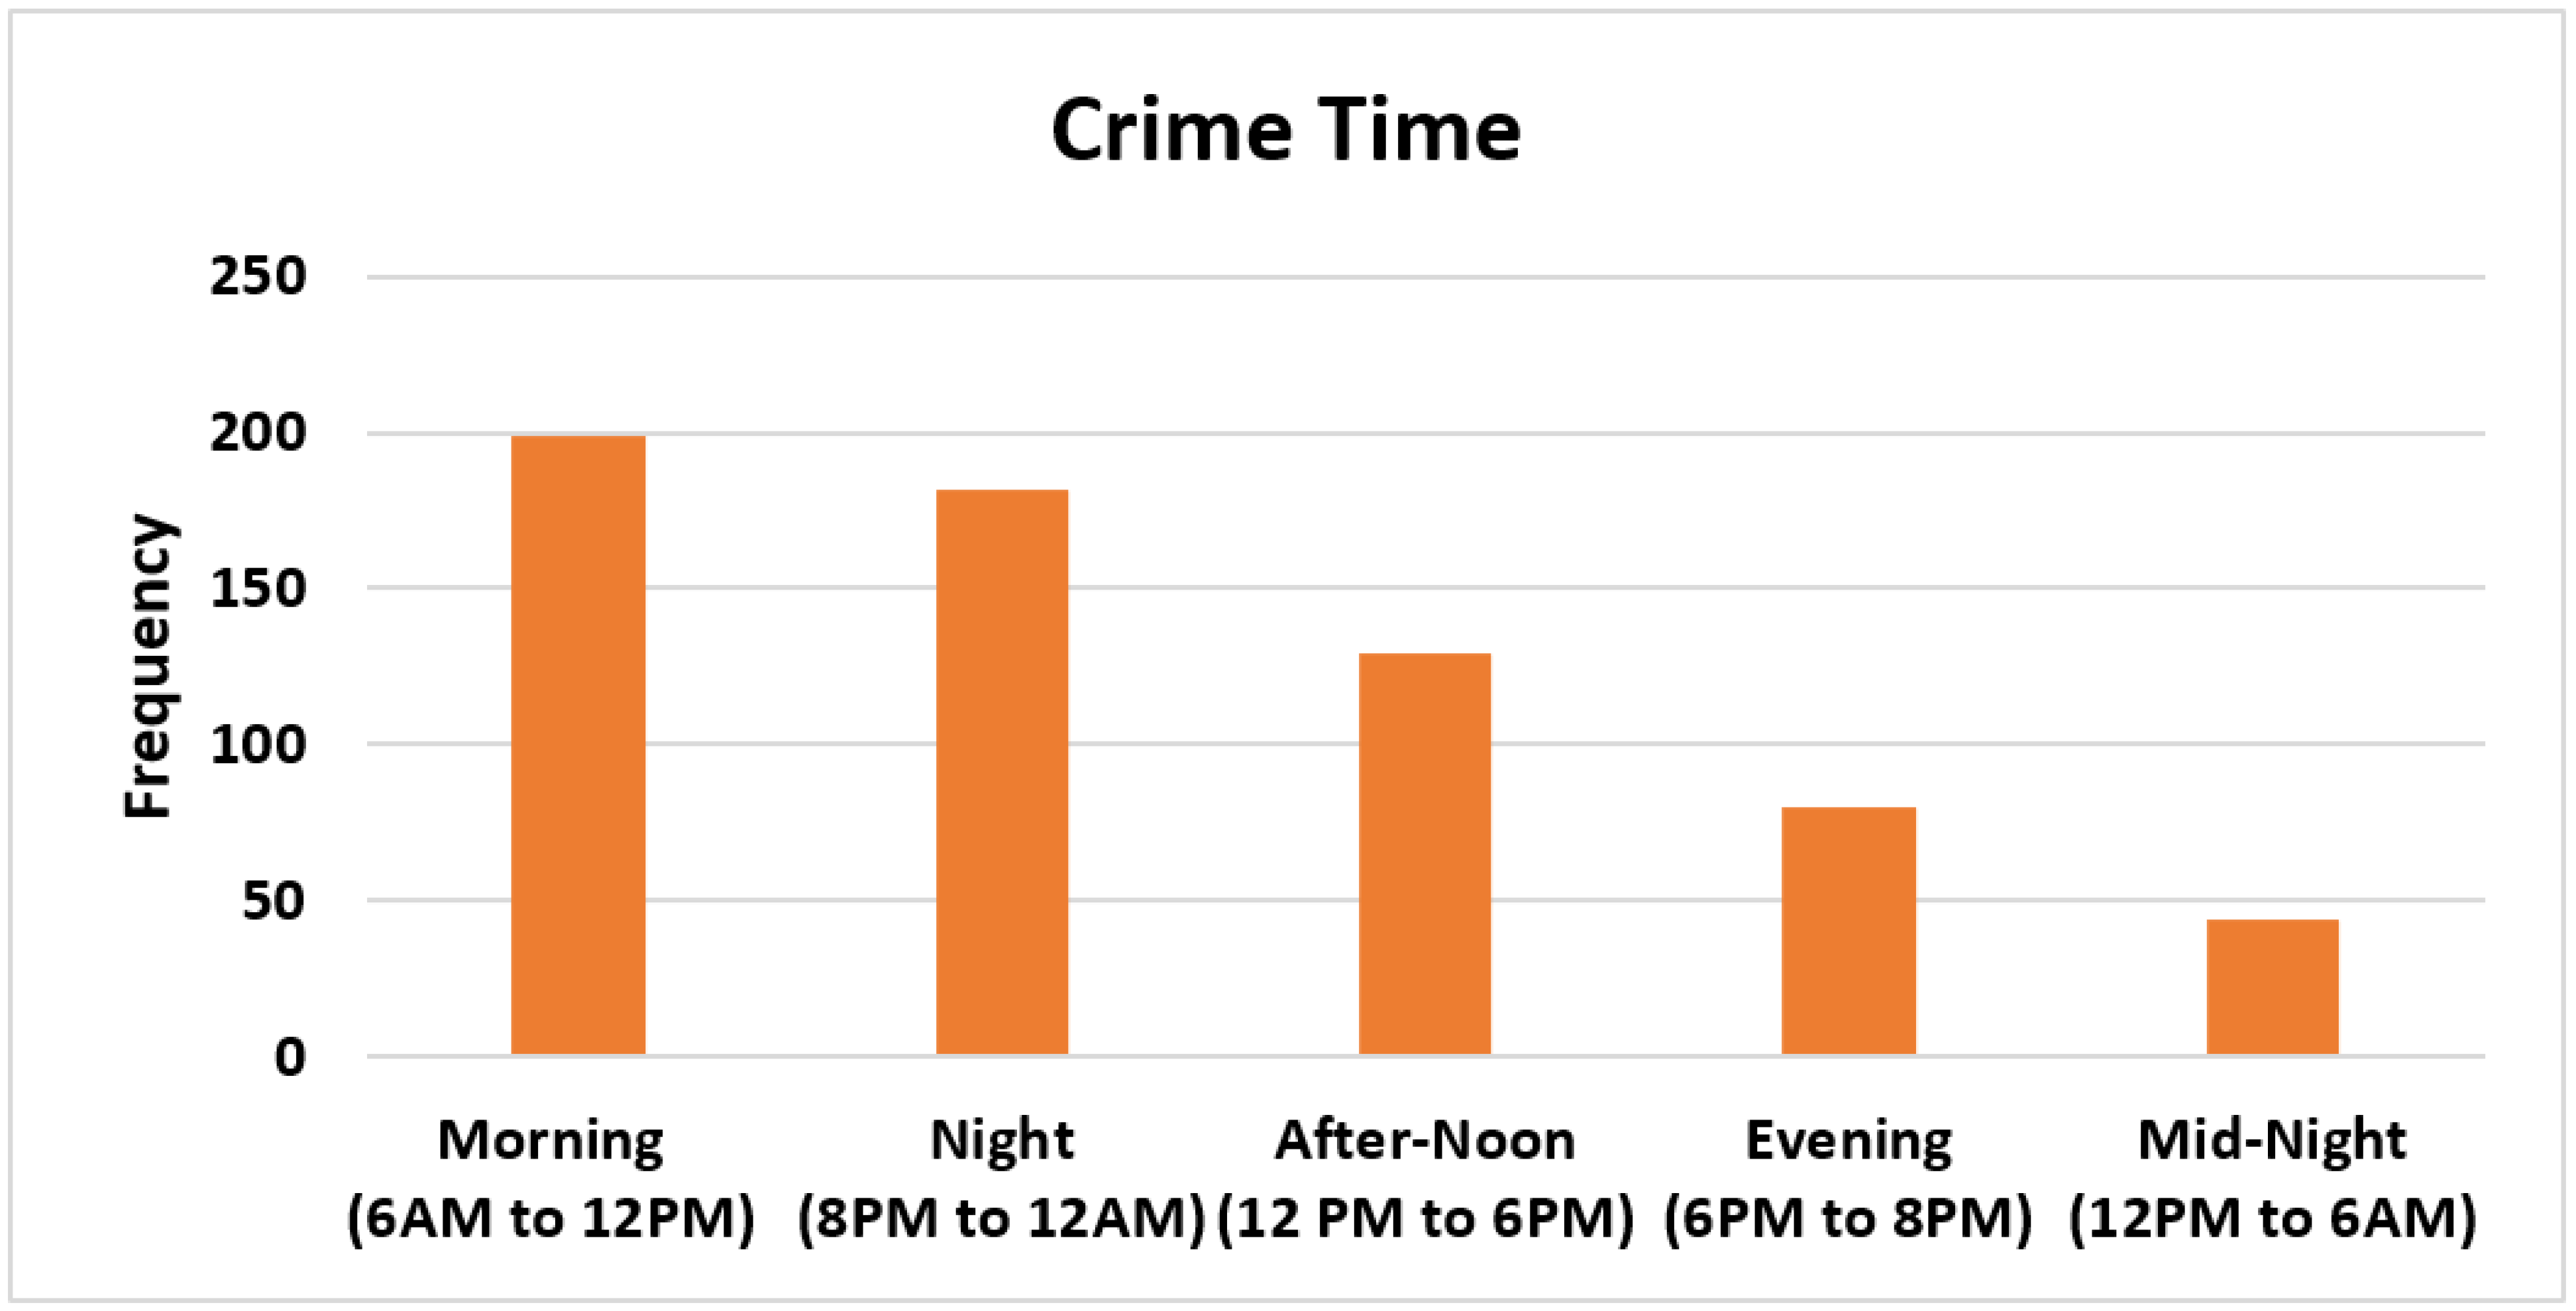
Seasonal and Geographic Variations
DUI arrests follow predictable seasonal patterns, with peaks occurring during summer months and around major holidays. New Year’s Eve, Fourth of July, and Labor Day weekend consistently show the highest arrest rates, prompting targeted enforcement campaigns during these periods.
Geographic analysis reveals significant regional differences in arrest rates. Rural areas often show higher per-capita DUI rates than urban centers, potentially reflecting limited public transportation options and different social drinking patterns. However, urban areas account for larger absolute numbers of arrests due to population density.
State-by-state variations in arrest rates partly reflect different enforcement priorities and legal frameworks. States with more aggressive enforcement policies and lower legal blood alcohol limits tend to report higher arrest rates, though this doesn’t necessarily correlate with higher impaired driving rates.
Weather patterns also influence arrest statistics, with clear weekend evenings generating more DUI stops than inclement weather periods. This correlation highlights how environmental factors interact with social behaviors to create predictable enforcement patterns.
Fatal Crash Statistics and Trends
Current Fatality Numbers
The National Highway Traffic Safety Administration reports that alcohol-impaired driving fatalities account for approximately 28% of all traffic deaths annually, representing roughly 10,000 lives lost each year. This percentage has remained relatively stable over the past decade, despite overall improvements in vehicle safety technology.
Fatal crash statistics reveal that drunk driving deaths affect all age groups, though young adults face disproportionate risks. The 21-34 age group accounts for the largest percentage of alcohol-impaired driving fatalities, both as drivers and victims of impaired driving crashes.
Weekend fatalities show particularly stark patterns, with Friday and Saturday nights accounting for nearly 40% of all drunk driving deaths despite representing only 28% of the week. These concentrated risk periods highlight the relationship between social drinking patterns and fatal crash occurrence.
The average blood alcohol content in fatal drunk driving crashes significantly exceeds legal limits, with most fatal crashes involving drivers with BACs of 0.15 or higher—nearly twice the legal limit of 0.08. This suggests that drivers in fatal crashes aren’t marginally impaired but severely intoxicated.
Long-term Fatality Trends
Historical data shows dramatic improvements in drunk driving fatality rates since the 1980s, when alcohol-related deaths comprised over 40% of all traffic fatalities. The decline to current levels around 28% represents thousands of lives saved through improved enforcement, education, and legal reforms.
However, progress has stagnated in recent years, with fatality percentages remaining relatively flat since 2010. Some experts worry that initial “low-hanging fruit” improvements have been achieved, making further progress more challenging without new approaches.
The introduction of rideshare services like Uber and Lyft correlated with measurable reductions in drunk driving fatalities in many metropolitan areas. Studies suggest these services may prevent hundreds of deaths annually by providing convenient alternatives to drunk driving.
Despite overall progress, certain demographic groups continue showing concerning trends. Repeat offenders remain significantly overrepresented in fatal crashes, highlighting the ongoing challenge of preventing recidivism among high-risk drivers.
Demographic Analysis of DUI Incidents
Age Group Patterns
Young adults aged 21-29 show the highest rates of DUI arrests, accounting for nearly 30% of all drunk driving arrests despite representing only 12% of licensed drivers. This concentration reflects both higher rates of binge drinking and less experience managing alcohol consumption responsibly.
The 30-39 age group represents the second-highest arrest category, suggesting that drunk driving behavior often persists beyond young adulthood. Combined, drivers under 40 account for over 60% of all DUI arrests, highlighting the importance of early intervention and education programs.
Interestingly, while older adults show lower arrest rates, they face higher fatality rates when crashes occur. Drivers over 65 involved in alcohol-impaired crashes are more likely to die from their injuries, reflecting both physical vulnerability and the tendency for older impaired drivers to have higher blood alcohol levels when arrested.
Teen drivers show relatively low DUI arrest numbers due to zero-tolerance laws and lower alcohol access, but any impaired driving in this age group carries extremely high crash risks due to inexperience with both driving and alcohol effects.
Gender Differences
Men account for approximately 75% of all DUI arrests, reflecting both higher rates of alcohol consumption and greater likelihood of driving while impaired. This gender gap has remained consistent over decades of data collection, suggesting deep-rooted behavioral differences.
However, women’s representation in DUI statistics has gradually increased over the past 20 years, potentially reflecting changing social roles and drinking patterns. Some regions report women accounting for 30% or more of DUI arrests, particularly in urban areas with active nightlife scenes.
Fatal crash patterns show even starker gender differences, with men accounting for over 80% of drivers killed in alcohol-impaired crashes. This disparity reflects both higher impairment rates and more dangerous driving behaviors when intoxicated.
Women involved in drunk driving incidents often show different patterns than men, including higher likelihood of prescription drug involvement and different peak arrest times. Understanding these differences helps inform targeted prevention strategies.
Repeat Offender Statistics
Repeat DUI offenders represent a disproportionate threat to public safety, accounting for roughly 30% of all drunk driving arrests despite being a small percentage of licensed drivers. These individuals often have underlying alcohol use disorders requiring treatment rather than punishment alone.
Studies tracking repeat offenders show that most second arrests occur within three to five years of the first conviction, highlighting critical intervention windows. Early treatment and monitoring programs during this period can significantly reduce recidivism rates.
The most dangerous subset includes third-time and subsequent offenders, who show extremely high rates of continued drunk driving even after multiple convictions. These chronic offenders often require intensive supervision, treatment, and sometimes permanent license revocation to protect public safety.
Ignition interlock devices have proven particularly effective at reducing recidivism among repeat offenders, with studies showing 67% reductions in repeat arrests while devices are installed. However, recidivism rates often increase after device removal, suggesting the need for longer intervention periods.
Regional and State Variations
Highest and Lowest Rate States
Montana, North Dakota, and Wyoming consistently rank among states with the highest per-capita DUI arrest rates, potentially reflecting rural culture, limited public transportation, and social drinking patterns. These states often struggle with enforcement challenges due to vast geographic areas and limited law enforcement resources.
Conversely, states like New York, Massachusetts, and New Jersey show lower per-capita arrest rates, possibly due to extensive public transportation networks, higher population density, and different social attitudes toward drunk driving. Urban environments may provide more alternatives to driving while intoxicated.
However, raw arrest rates don’t tell the complete story, as enforcement priorities and legal frameworks vary significantly between states. Some states with lower arrest rates may have more effective prevention programs reducing overall drunk driving behavior.
Fatality rates show different patterns than arrest rates, with some states having low arrest rates but high fatality rates, suggesting either enforcement gaps or higher crash severity when drunk driving incidents occur. These discrepancies highlight the complexity of measuring drunk driving’s true impact.
Urban vs. Rural Patterns
Rural areas consistently show higher per-capita drunk driving fatality rates than urban regions, despite often having lower overall traffic volumes. Factors contributing to this disparity include limited emergency medical services, longer response times, and higher-speed crashes on rural highways.
Urban areas benefit from concentrated enforcement efforts, extensive public transportation options, and shorter distances between entertainment venues and residential areas. Cities with robust ride-sharing services show particularly low drunk driving rates among younger demographics.
However, urban areas face unique challenges including concentrated nightlife districts that can strain enforcement resources and create predictable drunk driving corridors. Weekend enforcement in entertainment districts requires significant police resources to maintain deterrent effects.
The suburban experience often falls between urban and rural patterns, with moderate public transportation access but car-dependent lifestyles that can encourage drunk driving. Suburban communities increasingly focus on prevention through education and alternative transportation programs.
Impact of Legal and Policy Changes
Blood Alcohol Limit Reductions
The nationwide adoption of 0.08 BAC limits in the early 2000s correlated with measurable reductions in drunk driving fatalities, with studies estimating 500-600 lives saved annually from this policy change alone. The lower limit increased arrest numbers initially as more impaired drivers faced legal consequences.
Some states have considered further reductions to 0.05 BAC, following international trends and National Transportation Safety Board recommendations. Utah became the first state to implement 0.05 limits in 2018, though comprehensive data on its impact remains limited.
Zero tolerance laws for drivers under 21 have proven highly effective, with studies showing 20% reductions in fatal crashes among teen drivers. These laws demonstrate how targeted policies can achieve significant safety improvements for high-risk populations.
Legal limit changes must be accompanied by enforcement and public education efforts to achieve maximum effectiveness. Simple policy changes without supporting infrastructure often show minimal impact on actual driver behavior and crash rates.
Enhanced Penalties and Their Effects
Mandatory minimum sentences for DUI convictions have shown mixed results in reducing recidivism and fatal crashes. While deterrent effects are difficult to measure, enhanced penalties may prevent some first-time offenses and demonstrate society’s seriousness about drunk driving prevention.
Vehicle forfeiture laws allowing seizure of cars used in drunk driving offenses have gained popularity, particularly for repeat offenders. These laws can eliminate transportation used for continued illegal behavior while providing funding for enforcement and prevention programs.
Enhanced penalties for aggravated DUI offenses—involving high BAC levels, accidents, or children in vehicles—reflect public demand for proportional punishment. DUI defense attorneys, like those in Salt Lake City, understand that these laws acknowledge not all drunk driving incidents carry equal risks or deserve identical consequences.
However, some researchers argue that certainty of punishment matters more than severity, suggesting that consistent enforcement of moderate penalties may be more effective than harsh but sporadically applied consequences.
Conclusion
DUI statistics reveal progress and challenges in prevention efforts. While education and enforcement have helped, future advancements like autonomous vehicles and better monitoring systems could transform drunk driving prevention. Evidence-based policies and community action remain essential to save lives.